"A picture is worth a thousand words."
That was our motto as we learned about charts and graphs.
~~~~~~~~~
- First of all, we learned how to "read" charts and graphs.
- Then we did a group project called, "Where Do Our Clothes Come From?"
- Then we were ready to venture out and ask our fellow schoolmates our personal survey questions.
"Do you like bugs?" he asked his sister.
"What kind of pet do you have?" she asked her brother.
"What is your favorite food?"
"What is your favorite color?"
"How many languages do you know?"
~~~~~~~~~
We kept track of the answers:
"What is your favorite color?"
"What kind of pet do you have?"
"Do You Like Bugs?" no, yes, kinda
~~~~~~~~~
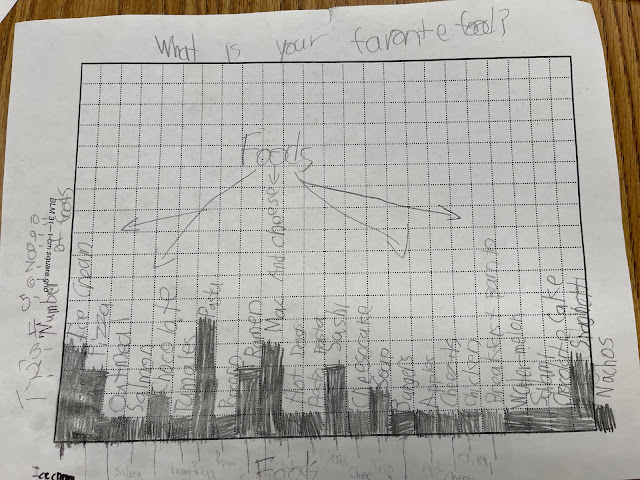
We made a bar graph on graph paper.
It included a title and labels for the x and y axis.
"Where Do Our Clothes Come From?"
"What Is Your Favorite Food?"
~~~~~~~~~
We made computerized graphs using Create-a-Graph
(Each student made a bar, line, area, and pie graph.)
"What Is Your Favorite Food?"
"How Many Pets Does Your Class Have?"
"Where Do Our Clothes Come From?"
~~~~~~~~~
~~~~~~~~~
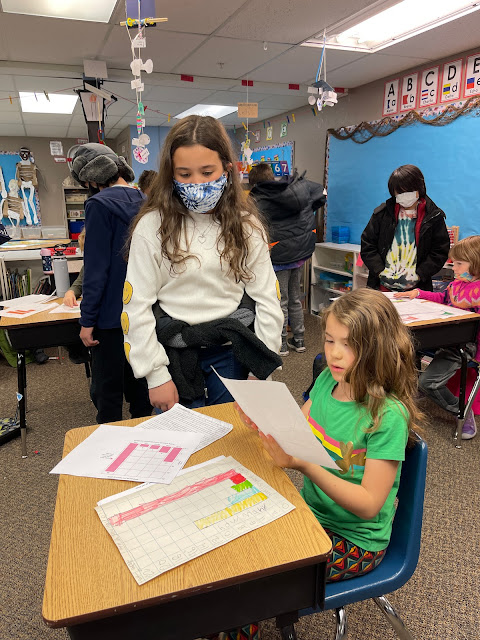
We showed our graphs to our friends.
We invited the fifth graders to come see our displays of graphs.
The Navigators were so proud of themselves.
The fifth graders were quite impressed, too.
Real math. Real school. Gifted education.


No comments:
Post a Comment